VegaChart.com
Website Tool Showcase
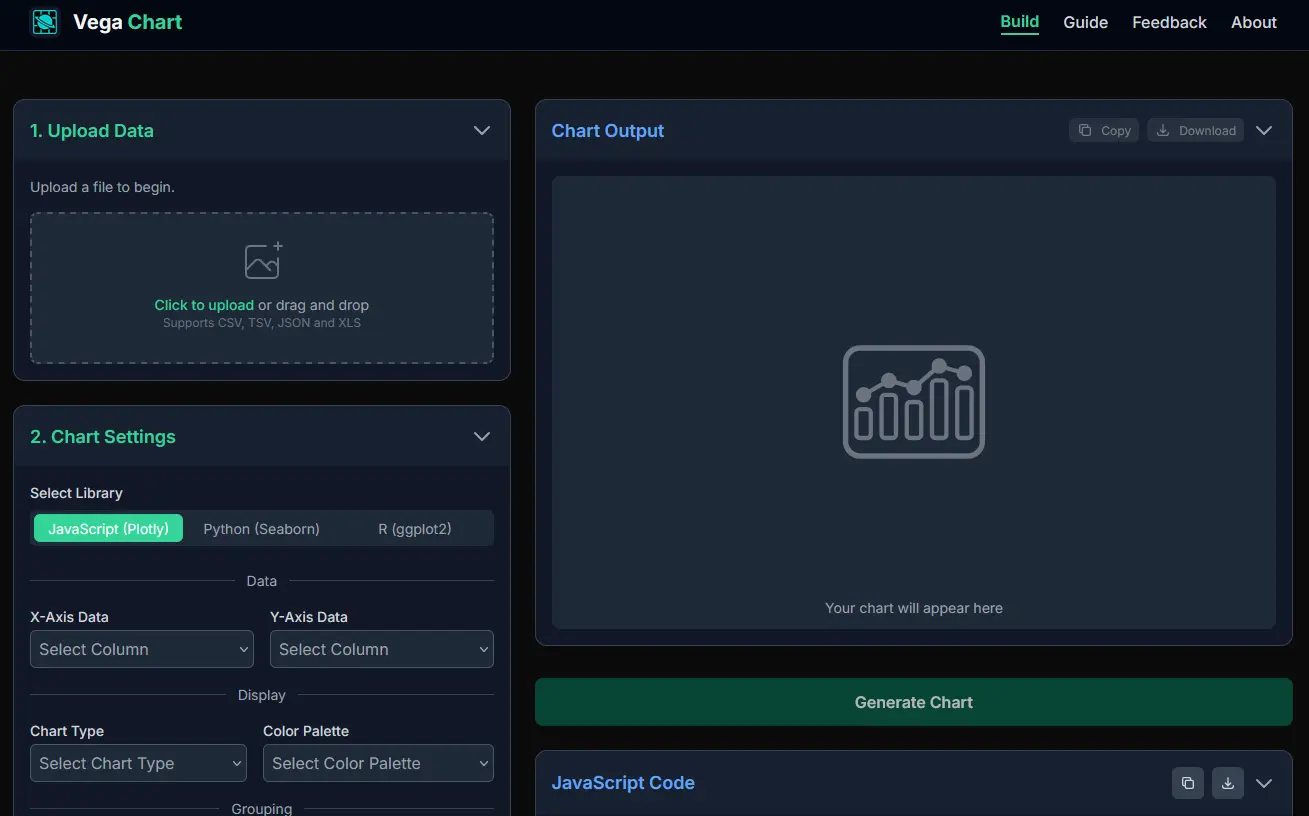
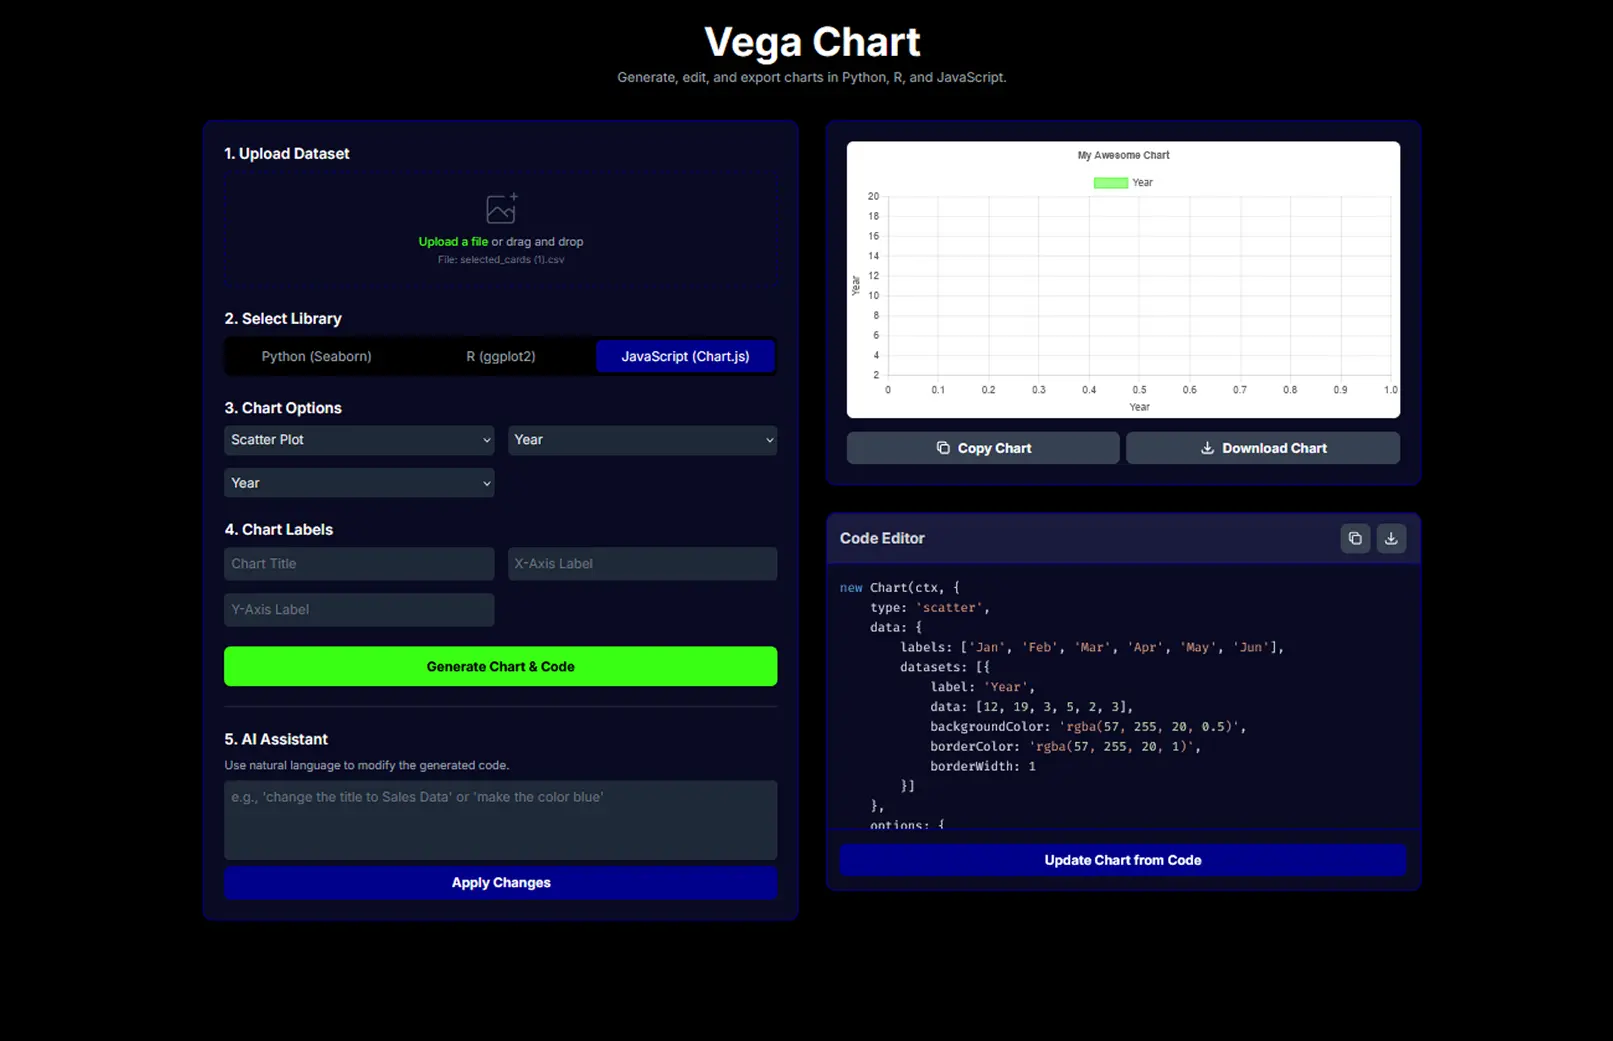
VegaChart interface - chart generation workflow
Project Specs:
- Timeline: Aug 2025 - Sep 2025
- Platform: Web (Mobile & Desktop)
- Website: VegaChart.com
Skills Used:
- HTML & CSS
- JavaScript
- Python
- R
- SQL
- User flows
- Wireframing & Prototyping
- Data visualization
Project Description
Vega Chart is an open-source web tool that transforms data into custom visualizations through an intuitive, step-by-step interface. Users can upload data files and create personalized graphs with custom labels, columns, and chart types, then export them in their preferred programming language. The project bridges the gap between rapid AI-generated charts and the customization of traditional programming approaches.
Design Philosophy
I designed Vega Chart to combine the speed of AI tools with the privacy and customization of programming languages. The tool offers a guided experience that maintains advanced control for technical users while providing accessibility for those without strong statistical backgrounds. This dual approach ensures functionality doesn't come at the expense of usability.
User-Centered Features
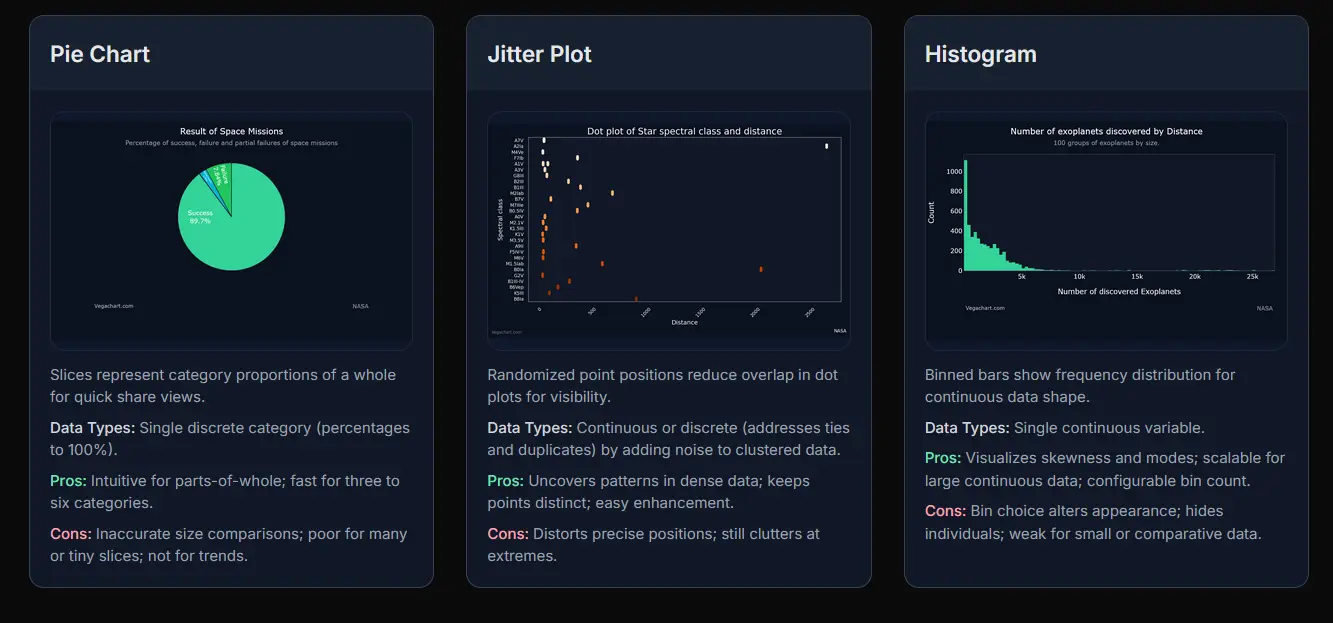
The interface adapts to different experience levels through intelligent automation. The system automatically identifies discrete and continuous variables, suggesting appropriate chart types based on data characteristics. Technical users retain granular control while benefiting from accelerated workflows, while novice users receive guidance through complex statistical decisions.
Diverse User Experience
Vega Chart serves a spectrum of users. From data scientists seeking rapid prototyping to business professionals or students needing clear visualizations without coding expertise. The thoughtful information architecture ensures each user type can efficiently achieve their goals through pathways tailored to their specific needs and technical comfort level.